I was looking for tool which could help me check who is using my bandwidth. Here are requirements which I want from this kind of tool:
- local hosts bandwidth distribution – it is helpful when you are loosing your bandwidth and don’t know who abuse it in your local network
- remote hosts bandwidth distribution – it is useful in situation when you want to have control over DoS attacks for your public homepage or when your QoS are not set well
Gargoyle
My first shoot is to check what features can give me my TP-Link TL-WR941ND router. I’ve installed on it Gargoyle (modification of OpenWRT with some additional features) some time ago. It has some useful monitoring features:
- bandwidth distribution pie charts which answer for my first requirement but I can’t check the time when bandwidth was used there
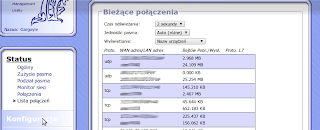
- connections track – from this I can check two sides of connection (also remote host) and how much of data was send/received but it also doesn’t show this information in time domain and it is served in less friendly, text form
It was no exactly what I’m looking for. Therefor I checked what what can we find in OPKG (OpenWRT Package Management).
SNMP + NagiosGraph
I tried to find how I can link Nagios (with NagiosGraph) with my router because I already have some experience with this tools. I found out that there is check_snmp Nagios plugin which can realize this. In OPKG there is mini-snmpd package. It is light SNMP server implementation. You can run it after login by SSH to you router and execute this command:
Other software
I continue searches in OpenWRT packages. I came across good OpenWRT wiki page: http://wiki.openwrt.org/doc/howto/bwmon describing some available stuff.
ntop
Among other there is mentioned ntop – extensive application written in C with many views showing statistics of network protocols usage. Installation of this application on my router with 400MHz CPU will be not the best idea. So I tried to install it on my home server and only send data to it from router by fprobe. At first I installed ntop available from ubuntu 12.04 server’s APT repository. There is available 3:4.1.0+dfsg1-1 version. After some simple configuration steps ntop start drawing graphs.
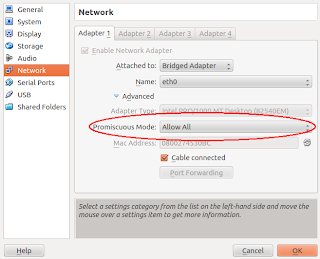
listening on interface in promiscuous mode
Some time ago I’ve done tcpdump logs analyzer on my studies. I remind that interface working in promiscuous mode can collect all data about local network traffic just like the router. To enable this mode you should exec this command:
ntop v.5.0.2
After this settings we can run ntop on any server in our local network. I give a try for a development version which you can download from ntop homepage: http://www.ntop.org/get-started/download/. Configure script led me through necessary packages that you must install before compilation. After this I run make and sudo make install. To manage ntop using init scripts I used existing /etc/init.d/ntop script and just edited a line with location of DEAMON value – setting them to /usr/local/bin/ntop value. I also removed -n 0 switch from /etc/default/ntop because I hope that bug with DNS resolution is already fixed (it is a little note in config about it).
I started deamon by service ntop start. In syslog there was nothing alarming – ntop started collecting traffic statistics. After login I checked available features.
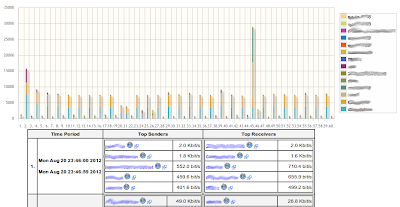
- Network load – this page shows all load in our network in four time intervals: 10mins, last hour, last day, last month
- Top talkers – similar to network load intervals, shows how hosts were using bandwidth in past
- Traffic maps: Region map & hosts map – ntop is connected to Google Maps and shows where are located hosts that we are talking to
- Activity: how changes activity of hosts in every hour
- And other – there are other useful things like Protocol statistics, Map of connections between hosts generated in dot and many more
little fix
This tests help me find out that there is a little bug in page showing top talkers of an hour. I submitted patch fixing it to ntop’s request tracker if you are interested in: http://sourceforge.net/tracker/?func=detail&aid=3559097&group_id=17233&atid=367233. This is a patch to r5644.
On the end
My adventure with traffic monitoring tools ended on ntop. It is a great tool which fits my needs. Now I know who consumes my resources and can set QoS rules which make my internet connection more responsive.


