Introduction
Complaining and doing nothing to solve a problem. That’s what everybody does on the Internet. And that’s precisely what I am going to do. Why? Apache NiFi has recently proved to be powerful and effective tool for processing gigabytes of data in our telco integration project. Yet, sometimes I feel like I am just clicking too much to achieve small things. It hurts just like hitting your head against a door frame every time you enter your bedroom. Let’s take a closer look at it.
Navigation
Dividing complex data flows into the process groups is a great way of achieving modularization and reusability, however, navigation between them is rather painful. Imagine set of process groups with nested process groups with nested process groups… Every time I want to go from A->B->C to A->E->F I have to use a well-hidden breadcrumb for A and double click to get into E and F.
What is the problem? At the beginning I couldn’t even find the breadcrumb! I didn’t expect it to be at the very bottom of the screen as it is an untypical location for it. What I did expect however was a big shiny arrow go back. Moreover, having navigated to A->E->F I wanted to go back to A->B->C. As there was no “go forward / redo” button I had to search for components E and F among others which made me sacrifice my precious time.
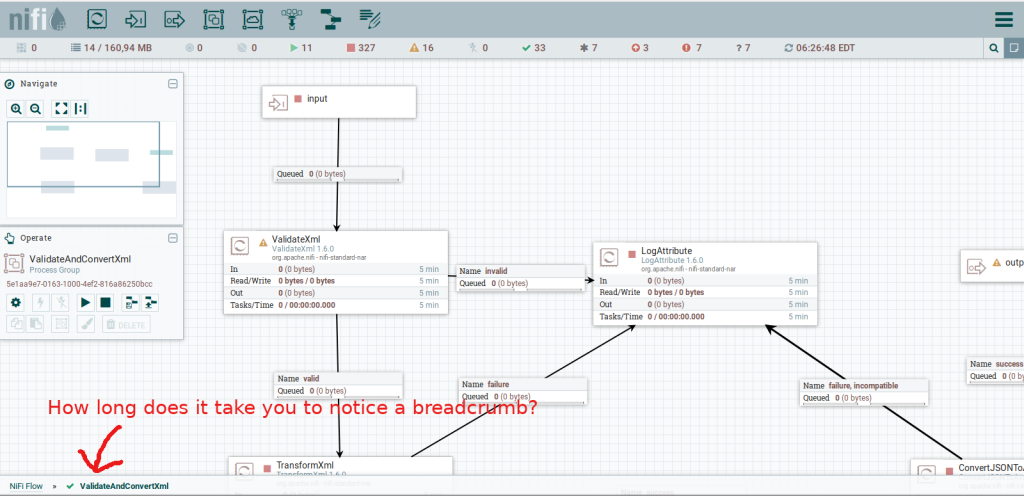
Why do I need to navigate so much you ask? Well, I am lazy and have rather short memory at the same time. What developing flows means for me is checking what I did yesterday and adjusting it to current problem. Maybe if I had a possibility to open yesterday’s flow in another tab I wouldn’t change those views at all? My internet browser can obviously do that but it has some limits like copy-paste. Similar idea is a screen division. I know it is all difficult to achieve but I would find it a major improvement.
List queue
When I integrate with external data source all I have is documentation and hope for its correctness. In fact this rule applies to every new NiFi processor I try. When something fails I investigate the reason of failure. When everything seems right I ensure that it truly is. In both scenarios I check the first element in the queue.
Again, my expectations are simple. I double click the queue to see what it contains because it is the most interesting feature of a queue: it holds elements. According to my experience 95% of times when I do anything related to a queue I check its first element. Sadly, when double clicking I see a configuration window which comes useful from time to time. Still, in my opinion it is not as important as the content itself.
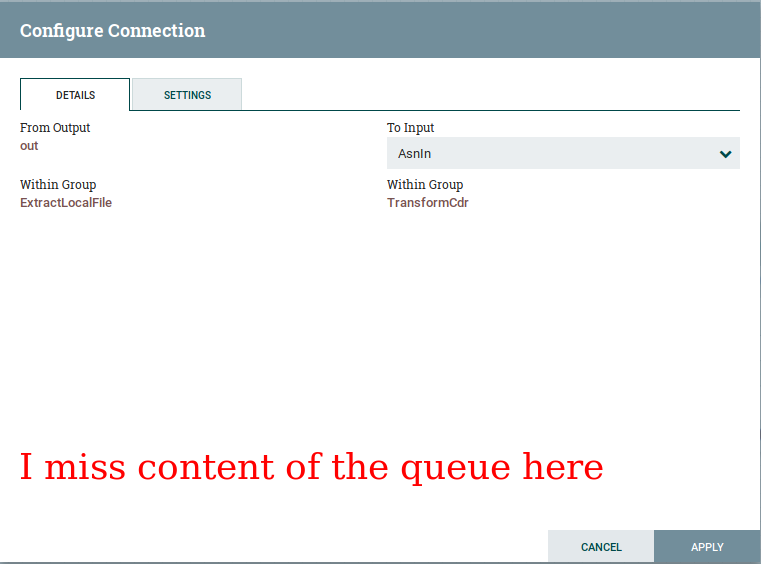
So how do you see elements of a queue anyway? Just like starting engine with cables: not easy but one can get used to it. Open context menu, select “List queue” and click the “info” button on the very left. Clicking the button is the weirdest step for me. It does not look like a button at all and I discovered its ‘clickability’ only because my friend told me about it.
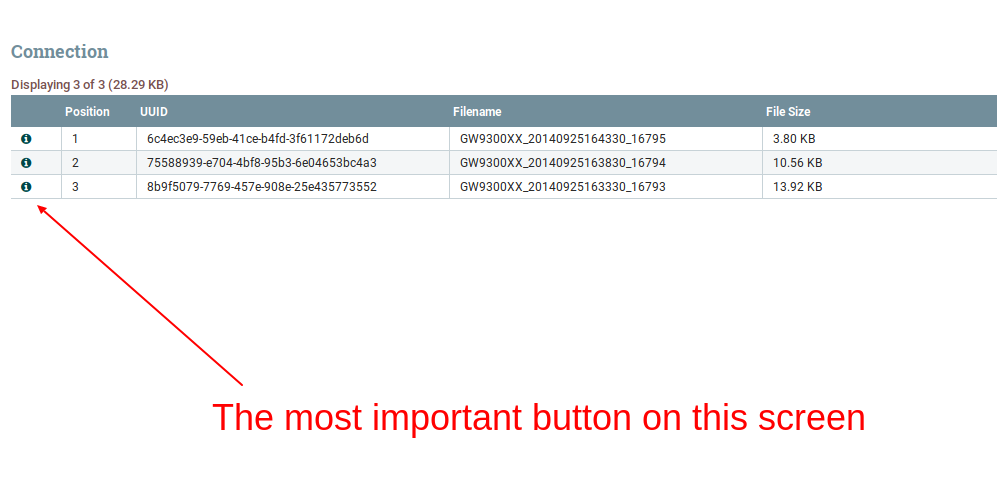
I am sure there must be faster way to take a quick look at the queue content. I know that the current state is consistent with the processors front-end design but I do not feel a there’s such a strong link between queues and processors. What you typically do with a processor is configuration but what you typically do with a queue is checking the content details.
Error display
NiFi displays error in flows with big red label located in the top right corner of the processor / process group. I have nothing against it. Yet, what does a true programmer do when an error occurs? He or she copies an error message and enters stack overflow :)
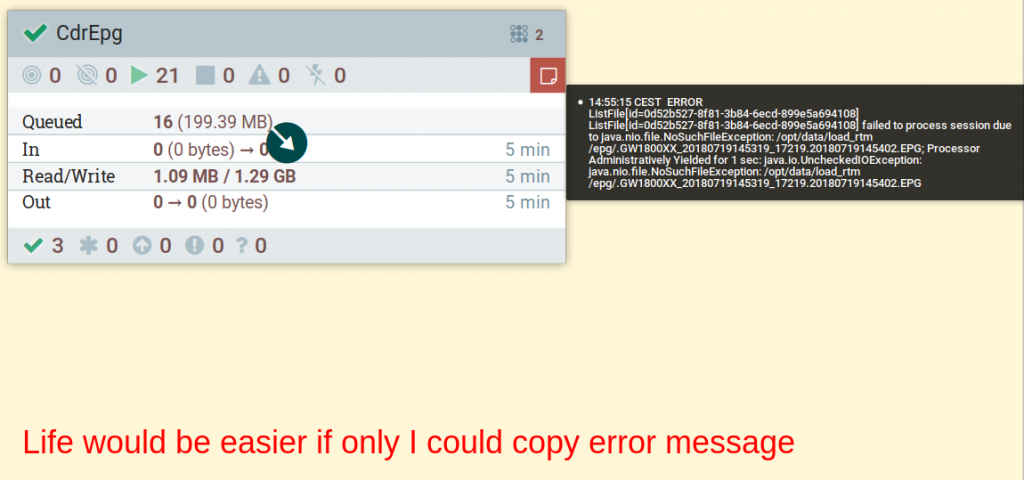
And here comes the problem: there is no way to copy an error from NiFi GUI. My workaround is to open logs. Usually, it takes ages. Sometimes it is even impossible. As a software vendor company we struggle with the limited access to hosts and services on everyday basis. Just let me copy my own errors and i will do my job. Trust me I’m an engineer.
Surprisingly in the review my colleague noted that I can actually copy errors from Bulletin board located in the main settings menu. However, I find it a bit dissapointing as the messages are incomplete and the menu itself is hidden deeply.
Templates
Exporting templates from one NiFi instance to another is another unintuitive feature. What I expect is to right click on a process group and choose export option. What I get is a sequence of actions:
- Create template
- Open “templates” from the main settings menu in a top-right corner
- Choose a very small “download” button that doesn’t look like a download button
I do not understand why I can’t export a process group which is not a template. Of course it has to be imported as a template but exporting seems to be just an on demand XML generation. What are the benefits of such dependency?
Summary
I hope that this post will not be taken as offensive by any means. As a programmer I know how difficult it is to design beautiful, functional and consistent frontend even for very simple application. Therefore, I would like to think about this case study as a guidance for everyone who designs UX. Ask your users about their habits, analyse how the application is used. Automating your client’s job will bring you tons of respect.
And what is your experience with NiFi GUI? I think it looks pretty good but still may be more functional and convenient. I hope it will be soon.
Finally I would like to thanks Michał Hofman and Bartłomiej Tartanus for the review.